Showing posts with label Map. Show all posts

Saturday, February 21, 2026

MAPS: Oklahoma voter registration changes, 2025 to 2026


Here's the 2026 installment of my long-running Voter Registration Maps series. As you can see, there is no blue on the map; the Republican Party has held leads in all 77 counties since March of 2024, the culmination of a decades-long trend, when Coal County became the final one to flip. 

Friday, January 31, 2025

Voter Registration Maps: Oklahoma gets redder with Trump


Here's the 2025 installment of my long-running Voter Registration Maps series. My last update came in May, after Coal County became the 77th and final county to have a Republican plurality. After a brief setback in 2023 (first decline in 26 years), registration changes once again benefited the GOP in 2024 - riding the Trump coattails, no doubt.

Thursday, November 07, 2024

Election Results Maps: More on Oklahoma's Trump vote

Following up on yesterday's post about Donald Trump carrying all 77 Oklahoma counties for the third time, here's another set of Election Results Maps from Tuesday. Trump scored 66.17% statewide (third highest for Republican presidential candidates, behind Reagan's 68.61% in 1984 and Nixon's 71.78% in 1972), beating Kamala Harris by 34.27%. First up, let's look at which direction Trump's 77-county win moved in each county compared to 2020.

Wednesday, November 06, 2024

Election Results Map: Trump carries all 77 Oklahoma counties for third time

Here is the much-anticipated 2024 general election edition of my long-running Election Results Maps series. I've been compiling these since 2010, which has included the 20122016, and 2020 presidential elections.

As you can see, former President Donald Trump carried all 77 counties, making 2024 the sixth presidential cycle in a row where the Republican nominee won every single one of Oklahoma's counties (dating back to 2004).

Tuesday, May 21, 2024

Coal County flips: Oklahoma GOP now leads in all 77 counties


The last installment of my long-running Voter Registration Maps series came in February, but this is a big milestone deserving of its own post. At long last, after 116½ years, Republicans lead voter registration in all of Oklahoma's 77 counties. 

Thursday, March 07, 2024

Election Results Maps: Trump mega-sweep, Biden loses one county

The presidential primary was on Tuesday, so it's time to update my long-running Election Results Maps series. Today, we look at how well - or how poorly - the presumptive major party nominees performed. 

First up, the Democratic primary:


As you can see, President Joe Biden cruised to 72.98% statewide, a lead of 45.96% over all challengers combined. However, he failed to carry all 77 counties, losing one (Cimarron) to Congressman Dean Phillips.

Biden clung to single-digit leads in three other counties - Coal (33.33%, a 2.2% lead over Phillips), Roger Mills (37.5%, a 1.4% lead over Phillips), and Washita (35.92%, a 4.9% lead over Phillips). He was held under 50% in 11 counties, and an even 50% in one more.

He did perform better than President Barack Obama did in his second-term primary; Obama received 57.1%, while losing 14 counties. On the other hand, President Trump set a record for incumbent presidents by scoring 92.6% in 2020 (including unanimous votes in 13.7% of all precints).

Speaking of Trump...


Former President Donald Trump, unsurprisingly, swept all 77 counties by commanding margins, with 81.83% statewide (a lead of 63.66% over all challengers combined). His worst showing was in Oklahoma County, where he led Nikki Haley by a 72.23% to 24.92% vote (a 47.3% lead for The Donald). He topped 90% in 23 counties, including two where he led by 90% (Coal with a 90.4% lead, and Choctaw with a 90.3% lead -- with 94.84% and 94.55% of the vote, respectively).

Granted, he's something of a semi-incumbent, at least within his own party, but I would surmise this to be the largest and most dominant primary performance by an individual who is not currently sitting in the White House.

Thursday, February 01, 2024

Voter Registration Maps: first GOP decline in 26 years


Here we go with the latest installment of my long-running Voter Registration Maps series. These statistics are from the annual January 15th report from the State Election Board. You can view my previous post from last week 'Oklahoma voter registration changes, 2023 to 2024' at this link.

In this post, I have graphics showing growth by county for all parties and for Independents, and a comparison of Democrats versus Independents by county. Take a look, and share with your friends:

Thursday, January 25, 2024

MAPS: Oklahoma voter registration changes, 2023 to 2024


Here we go with the latest installment of my long-running Voter Registration Maps series. These statistics are from the annual January 15th report from the State Election Board.

In this post, I have graphics showing registration leader by county, majority/plurality by county, and registration swing by county. We'll look at some additional data in another post. Take a look, and share with your friends:

Thursday, January 26, 2023

Voter Registration Maps: GOP now leads in all but 1 county, Dems slip behind Independents in 2 counties


Here we go with the latest installment of my long-running Voter Registration Maps series. These statistics are from the annual January 15th report from the State Election Board.

In this post, I have graphics showing registration leader by county, majority/plurality by county, registration swing by county, growth by county for all parties and for Independents, and a comparison of Democrats versus Independents by county (a new addition to my map collection). Take a look, and share with your friends:

Tuesday, November 15, 2022

Election Results Map: U.S. Senate, other statewide races

Earlier this week, I update my long-running Election Results Maps series with a post looking at the 2022 Oklahoma general election races for Governor, Lieutenant Governor, and State Superintendent. In this post, we'll cover the remaining statewide partisan races.

Overall, it was a Republican romp.

Saturday, November 12, 2022

Election Results Map: Gov, LtGov, and State Superintendent races


I've finally gotten the time to update my long-running Election Results Maps series with some posts looking at the 2022 Oklahoma general election.

For now, we'll look at the race for Governor, Lieutenant Governor, and State Superintendent. I'll work on additional races as I find the time.


Friday, November 04, 2022

75 to 2: Oklahoma Dems lead voter registration in just TWO counties, fall BEHIND Indies in one


Some big news here in the latest of my long-running Voter Registration Maps series. These statistics used in these graphics are sourced from the November 1st pre-election report from the State Election Board.

Friday, April 01, 2022

MAPS: Oklahoma voter registration changes, 2021 to 2022


I'm well overdue on updating my Voter Registration Maps series, but I finally got it all done. These statistics used in these graphics are sourced from the annual January 15th report from the State Election Board.

Be sure to check out my post with one more graphic, 70 to 7: Oklahoma Dems now lead voter registration in just SEVEN counties, which was published in February.

Sunday, February 13, 2022

70 to 7: Oklahoma Dems now lead voter registration in just SEVEN counties


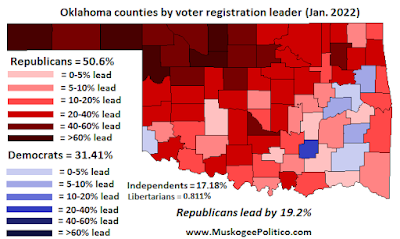
Here we go with the latest installment of my long-running Voter Registration Maps series. These statistics are from the annual January 15th report from the State Election Board(For nostalgia purposes, Democrats can look at my first map and see how much of Oklahoma was still blue and dark-blue in 2013)

Since last January, the GOP has taken the lead in eight counties: Atoka County (3.1% lead), Caddo County (4.22% lead), Choctaw County (2.54% lead), Greer County (5.32% lead), Haskell County (2.51% lead), Hughes County (2.28% lead), Johnston County (5.31% lead), and Murray County (4.83% lead)

Monday, March 29, 2021

Thursday, March 25, 2021

GOP Fever: Oklahoma's 2021 Voter Registration Map


I'm a bit behind due to recent craziness with work, but here we go with the latest installment of my long-running Voter Registration Maps series. These statistics are from the annual January 15th report from the State Election Board. (For nostalgia purposes, Democrats can look at my first map and see how much of Oklahoma was still blue and dark-blue in 2013)

Since last January, the GOP has taken the lead in sixteen counties: Adair County (5.43% GOP lead), Craig County (5.55% lead), Jefferson County (8.31% lead), Kiowa County (11.14% lead), LeFlore County (10.36% lead), Love County (1.06% lead), McCurtain County (1.23% lead), Marshall County (16.17% lead), Okfuskee County (0.81% lead), Okmulgee County (0.86% lead), Ottawa County (9.3% lead), Pittsburg County (2.18% lead), Pontotoc County (6.52% lead), Seminole County (4.87% lead), Sequoyah County (5.24% lead), and Tillman County (9.31% lead). 

Democrats hold the plurality or majority in just 15 counties: Atoka County (2.79% Democrat lead), Caddo County (0.11% lead), Cherokee County (9.55% lead), Choctaw County (3.63% lead), Coal County (35.6% lead), Greer County (1.36% lead), Harmon County (7.85% lead), Haskell County (3.69% lead), Hughes County (5.79% lead), Johnston County (0.21% lead), Latimer County (13.32% lead), McIntosh County (11.2% lead), Murray County (1.05% lead), Muskogee County (4.65% lead), and Pushmataha County (10.29% lead).

In January 2020, Democrats held majority status in 14 counties. As of January 15th of 2021, that had shrunk to just two: Coal (62.86%) and Latimer (51.81%).

Major County has the widest gap, with 78.39% Republicans and 12.45% Democrats.

Comanche County has the highest percentage of registered Independent voters at 20.48%, while Jackson County has the highest percentage of registered Libertarians at 0.897%. 

Over the next several days, we'll take a look at some more statistics and maps. For now, enjoy Oklahoma's rising GOP fever.

Thursday, November 05, 2020

Election Results Maps: U.S. Senate, State Questions 805 and 814

 Here is the much-anticipated 2020 general election edition of my long-running Election Results Maps series. As promised in my post on the presidential results in Oklahoma, we will be looking here at the U.S. Senate race and results from the two state questions that voter soundly rejected.

In his final election, Senator Jim Inhofe posted his second-best general election showing, behind only his 2014 matchup where he received 68% of the vote. His results largely trailed President Trump's by a few points, with Oklahoma County also being his closest with a 0.93% spread (48.33% to 47.4%). His best result came in Cimarron County with a lead of 84.71%


Next, let's look at the two state questions that were on the ballot.

Rural Oklahoma rejected State Question 805 in overwhelming fashion. This ballot measure won in Oklahoma County alone (54.21% to 45.79%, a 8.42% spread). The 'Yes' vote in Cleveland County trailed by 3.13%, Comanche by 7.2%, and Tulsa by 13.76%. All 73 other counties had a 'no' lead of at least 24%, with 20 at over 50%.

Election Results Map: Presidential Race

 Here is the much-anticipated 2020 general election edition of my long-running Election Results Maps series. I've been compiling these since 2010, which has included both the 2012 and 2016 presidential elections.

In this post, we'll take a look at the Presidential race results here in Oklahoma, and compare the 2020 presidential race to 2016. We'll examine the U.S. Senate raceand both state questions in a separate article.

First up, the big one:


As you can see, President Donald Trump carried all 77 counties, making 2020 the fifth presidential cycle in a row where the Republican nominee won every single one of Oklahoma's counties (dating back to 2004).

These figures were pretty wild. Oklahoma County was by far the closest, with a spread of just 1.21% and with Trump held to 49.25% of the vote. The next closest? Cleveland and Tulsa counties at spreads of 14.06% and 15.57%, respectively. They weren't even close. 

14 counties had Trump leads between 20% and 50%. 52 counties went red by margins between 50% and 75%, and Trump won in 8 counties by more than 75%

Monday, November 02, 2020

MAPS: Historic surge shoves GOP into majority in 13 counties and statewide

 The Oklahoma State Election Board released statistics showing that the Oklahoma Republican Party now has an outright majority of registered voters for the first time in Oklahoma history. I put that data into some maps to illustrate the simply massive sea change experienced in much of Oklahoma just this year.

Since January of this year, the GOP has taken the lead in the following 13 counties:

  • Adair County (down by -7.2% to up by 4.18%)
  • Bryan County (down by -2.75% to up by 8.58%)
  • Craig County (down by -7.7% to up by 4.41%)
  • Jefferson County (down by -5.34% to up by 6.15%)
  • Kiowa County (down by -1.46% to up by 10.18%)
  • LeFlore County (down by -10.18% to up by 8.95%)
  • Marshall County (down by -0.13% to up by 14.61%)
  • Ottawa County (down by -1.8% to up by 7.8%)
  • Pittsburg County (down by -14.44% to up by 0.72%)
  • Pontotoc County (down by -1.55% to up by 5.6%)
  • Seminole County (down by -5.21% to up by 3.92%)
  • Sequoyah County (down by -10.45% to up by 3.85%)
  • Tillman County (down by -2.58% to up by 8.58%)

Saturday, October 31, 2020

Maps: see where the GOP and Dems are overperforming in Oklahoma Early Voting

The Oklahoma State Election Board has been releasing data on the early voting turnout by day, with Saturday set to be the final day for early voting to take place. I took a look at the statistics, and put together these two maps to show what's currently going on.

This first map compares the voter registration leader in each county to the proportion of voters by party who have voted early thus far. A blue county means a higher percentage of Democrats have voted than are registered in that county, and vice-versa for red counties. 

Example A: as of January 2020, Adair County had 47.46% Democratic and 40.26% Republican. As of 5pm Friday, 46.38% of Adair County early voters were Republicans and 41.85% were Democrats. Adair County goes on the map as red due to a higher proportion of Republicans casting early votes than are registered.  

Example B: as of January 2020, Caddo County was 47.52% Democratic and 38.47% Republican. As of 5pm Friday, 53.16% of Adair County early voters were Democrats and 40.36% were Republicans. Adair County goes on the map as blue due to a higher proportion of Democrats casting early votes than are registered. 

Now for the map:


This next map looks at which counties have "flipped" so far in early voting.

Example A: as of January 2020, Johnson County was 51.13% Democratic and 35.95% Republican. As of 5pm Friday, 37.18% of Johnson County early voters were Democrats and 54.4% were Republicans. Atoka County is a registered Democrat-majority county with more Republicans voting early thus far than Democrats.

Example B: as of January 2020, Cleveland County was 47.9% Republican and 33.18% Democratic. As of 5pm Friday, 44.03% of Cleveland County early voters were Democrats and 41.79% were Republicans. Cleveland County is a registered Republican-plurality county with more Democrats voting early thus far than Republicans.

The map: