Friday, January 31, 2025
Tuesday, May 21, 2024
Coal County flips: Oklahoma GOP now leads in all 77 counties
Thursday, April 04, 2024
Monday, February 26, 2024
Thursday, February 01, 2024
Voter Registration Maps: first GOP decline in 26 years
Thursday, January 25, 2024
MAPS: Oklahoma voter registration changes, 2023 to 2024
Thursday, January 26, 2023
Voter Registration Maps: GOP now leads in all but 1 county, Dems slip behind Independents in 2 counties
Thursday, January 19, 2023
Oklahoma State Election Board releases annual voter registration statistics
(Oklahoma City) – An official voter registration report by the Oklahoma State Election Board shows 2,225,086 people are registered to vote as of January 15, 2023. The annual report comes days after the State Election Board conducted its statutorily-required voter list maintenance process, removing inactive voters and duplicate voters.
Monday, September 26, 2022
US House GOP unveils 'Commitment to America' platform
Cheyenne, OK (September 23rd) – Today, Congressman Frank Lucas (OK-03) released the following statement after House Republicans introduced the Commitment to America, a policy platform to create An Economy That's Strong, A Nation That's Safe, A Future That's Built on Freedom, and A Government That's Accountable:
Monday, June 27, 2022
Tulsa County GOP endorses Byrd for Auditor; OK County GOP Chair calls for opponent to drop out
Both the Republican Party of Tulsa County and the Oklahoma County Republican Party Chairman have come out in support of reelecting State Auditor Cindy Byrd, with the OK County Chairman calling for Steve McQuillen to drop out of the race.
You can read more from Oklahoma County GOP Chairman Ken Warner over at IgniteLiberty.
From the Tulsa County GOP:
Friday, April 01, 2022
MAPS: Oklahoma voter registration changes, 2021 to 2022
Saturday, March 19, 2022
"He should resign": Bennett faces criticism among CD2 GOP officials
Oklahoma Republican Party Chairman John Bennett has broken with traditional practices of the party office, endorsing multiple candidates for office (most prominently Jackson Lahmeyer against U.S. Sen. James Lankford), and is now running for Congress. Indications from his OKGOP staff, some of whom appear to be doing double duty on his congressional campaign, are that he has no intention to step down as chairman until at least after candidate filing.
For comparison, in 2006 and 2010, then-OKGOP chairman Gary Jones resigned within days of announcing his candidacy for State Auditor to avoid any appearance of a conflict of interest (in 2010, he filed on Wednesday and resigned on Monday).
State Party rules are silent on the issue of party officials endorsing in primaries or running for public office while holding party positions. Bennett's decision to do both has broken no rules. However, there are many party activists who find both actions to be inappropriate for a state chairman to do. I've heard from some of those individuals, and decided to reach out to party officials within the 2nd Congressional District to see how widespread that sentiment was.
Based off some of the input I had already received, I asked the following questions of the county central committee (chair, vice chair, two state committee members) of each county Republican Party in the 2nd District:
- Do you think John Bennett should stay on as state chair while running for Congress, or should he resign?
- Should state party rules be amended to require a state chair or vice chair to resign if running for state or federal elected office?
Sunday, February 13, 2022
70 to 7: Oklahoma Dems now lead voter registration in just SEVEN counties
Friday, April 02, 2021
Survey shows sharp divide among OKGOP delegates over electronic convention voting
The 2021 Oklahoma Republican Party State Convention will be held on Saturday, April 10th, and a new system of voting seems to be stirring up some controversy among the delegates.
For decades, voting at the State Convention has been done in person and with paper ballots. Last year changed all of that, due to the coronavirus turmoil. I have not attended a state convention in several years, so my knowledge of the particulars is based on conversations with individuals who did attend. The 2020 state convention was held virtually via Zoom, which resulted in significantly reduced participation and some technical struggles that often plague events of this size when thrown together without adequate preparation or training.
This year, the convention will be held in person -- but voting will be done through an online program. Delegates are expected to bring their own electronic device in order to participate.
Needless to say, this is a significant development in the OKGOP, and one that is going to be contested. In conversations with a fellow church member recently, I was told that several older delegates from their county won't be attending this year as they do not own smartphones or laptops, which would be required to vote with. This "technology divide" will likely hit hardest among senior citizen and rural delegates (in other words, a significant position of the usual delegate makeup).
I was forwarded the results of an email survey that was recently conducted, sent out to all registered delegates, regarding the convention's online voting system. Nearly 20% of the around 1,800 delegates responded to the survey, giving us a good sample size to consider.
Thursday, March 25, 2021
GOP Fever: Oklahoma's 2021 Voter Registration Map
Since last January, the GOP has taken the lead in sixteen counties: Adair County (5.43% GOP lead), Craig County (5.55% lead), Jefferson County (8.31% lead), Kiowa County (11.14% lead), LeFlore County (10.36% lead), Love County (1.06% lead), McCurtain County (1.23% lead), Marshall County (16.17% lead), Okfuskee County (0.81% lead), Okmulgee County (0.86% lead), Ottawa County (9.3% lead), Pittsburg County (2.18% lead), Pontotoc County (6.52% lead), Seminole County (4.87% lead), Sequoyah County (5.24% lead), and Tillman County (9.31% lead).
In January 2020, Democrats held majority status in 14 counties. As of January 15th of 2021, that had shrunk to just two: Coal (62.86%) and Latimer (51.81%).
Major County has the widest gap, with 78.39% Republicans and 12.45% Democrats.
Comanche County has the highest percentage of registered Independent voters at 20.48%, while Jackson County has the highest percentage of registered Libertarians at 0.897%.
Tuesday, March 17, 2020
1st District GOP Convention postponed
CD1 Chair Amanda Teegardan:
Attention Delegates to the Republican 1st District of Oklahoma
Due to unprecedented circumstances, the District Conventions are being postponed to a date to be determined; District 1 will not be meeting on 3/28/20.
The District Chairmen are awaiting guidance from the RNC and the State GOP. We will keep you posted as to how we are to proceed. Thank you for your understanding.
"Be anxious for nothing, but in everything by prayer and supplication with thanksgiving let your requests be made known to God." Phil. 4:6
Blessings,
Amanda Teegarden
Chair, OK Rep. District 1
Monday, March 16, 2020
Monday, February 03, 2020
Voter Registration Maps: A Decade of Massive Change
First up is an animated graphic showing the voter registration by county. There's been a 22.09% swing to the GOP since 2010. A decade ago, Democrats held a 9.16% lead over Republicans (49.05% to 39.89%) -- last month, the GOP was ahead by 12.93% (48.25% to 35.32%).
In 2010, the GOP's largest lead was in Beaver County, ahead of the Democrats by 40.77%. Democrats had 11 counties where they led the GOP by greater than 60% (in four of those it was by over 70%).
Fast forward a decade, and Republicans now lead Democrats by 60% in two counties, and Democrats have just one county with a 40+% lead (ahead by 47.07% in Coal County):
This next map shows the swing in each county. It has been especially dramatic in the southern portion of the state. The shifts in Oklahoma and Tulsa counties have been almost exclusively due to the growth of Independents at the expense of Democrats. In both counties, GOP percentages increased by less than 1%, Independents by 5-6%, while Democrat's fell by 6%.
This map shows the change in majority and plurality parties since 2020:
Republican majority: 14 (2010) to 35 (2020) = +21
Republican plurality: 10 (2010) to 10 (2020) = no change
Democratic plurality: 4 (2010) to 18 (2020) = +14
Democratic majority: 49 (2010) to 14 (2020) = -35
Truly remarkable.
Thursday, January 23, 2020
Voter Registration Maps: Party Growth, 2019 to 2020
Republicans made some slight improvements on the 2019 figures, gaining ground in 74 counties and dropping in just three (as opposed to 71 to 6 last year). The losses came in the urban counties of Cleveland, Oklahoma, and Tulsa, but maxed out at a shift of -0.31% in Oklahoma County. The average drop in those three counties in 2019 was -0.62%, but this year it was -0.19%, so... something to be grateful for as a Republican, I suppose.
Haskell County was once again the highest growth spot for the GOP, increasing as a percentage of the registered voters there by +5.35%. Increases were the lowest in northern and central Oklahoma, and greatest in the southeast, each indicative of the overall registration ratios in the regions.
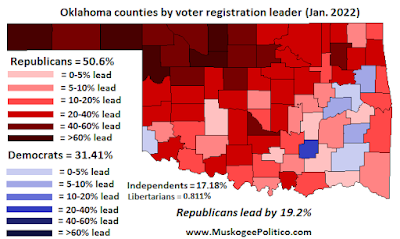
Statewide, Republicans rose to 48.25% of all registered voters, an increase of +0.82%.
As with every year since 2014, Democrats declined as a percentage of registered voters in all 77 counties. Their best county was Oklahoma County, where they fell by 0.25%. Tulsa County was close behind at -0.26%. Haskell County was the worst performer for the Democrats, with their percentage plummeting by 5.68%.
Statewide, the Democrats fell by 1.25% to 35.32% of all registered voters.
Independents lost ground in 14 counties, and increased percentages in 63 counties. Ottawa County led the way for the third time in four years, with an increase of +0.81%, while Woodward County had the greatest loss at -0.74%.
Independents had higher increases than Republicans in 8 counties (Canadian, Cleveland, Comanche, Garfield, Oklahoma, Payne, Tulsa, and Washington). Statewide, Independents increased by +0.32%, bringing them up to 15.89% of all registered voters.
Libertarians outgrew Independents in 20 counties (Atoka, Beaver, Bryan, Cherokee, Coal, Craig, Delaware, Ellis, Grant, LeFlore, Lincoln, Logan, Muskogee, Nowata, Pittsburg, Rogers, Texas, Washington, Washita, and Woodward).
For that matter, they increased their share of registered voters more than the Democrats in all 77 counties, and more than the GOP in the following five counties: Canadian, Cleveland, Oklahoma, Tulsa, and Washington.
Statewide, Libertarians increased by +0.098%, putting them at 0.534% of all registered voters in Oklahoma. Their highest percentage is in Payne County, at 0.754%.
Tuesday, January 21, 2020
Oklahoma Voter Registration Map, January 2020
In the latest installment of my long-running Voter Registration Maps series, we will once again take a look at voter registration across the state. These statistics are from the annual January 15th report from the State Election Board. (For nostalgia purposes, Democrats can look at my first map and see how much of Oklahoma was still blue and dark-blue in 2013)
Since last January, the GOP has taken the lead in Roger Mills County (6.63% GOP lead), Cotton County (4.34% lead), and neighboring Comanche County (0.74% lead). Democrats still cling to narrow margins in Marshall County (0.13% Democrat lead), Kiowa County (1.46% lead), Pontotoc County (1.55% lead), Ottawa County (1.8% lead), Tillman County (2.58% lead), Bryan County (2.75% lead), Seminole County (5.21% lead), and Jefferson County (5.34% lead).
Coal (68.78%), Latimer (61.24%), and Pushmataha (60.35%) are the lone counties with over 60% registered Democrats. Even in Coal County, however, the Democratic lead over GOP registration has dropped to 47.07%; a decade ago, that lead in Coal County was 70.38%, with 82.53% of registered voters being Democrats.
Major County is the most polarized county, with 77.6% Republicans and 13.9% Democrats.
Comanche County has the highest percentage of registered Independent voters at 20.03%, while Payne County has the highest percentage of registered Libertarians at 0.754%. Incidentally, Comanche County has the highest percentage of voters outside of the two main parties, with 20.62% registered Independent or Libertarian -- 1.55% higher than the next closest county (Carter, 19.14%). That's the largest such gap in the rankings.