Showing posts with label 2013. Show all posts

Tuesday, February 25, 2014

Inhofe, Coburn, Bridenstine rank high in Club for Growth's 2013 scorecard


Club for Growth issued their 2013 scorecard yesterday, and some members of Oklahoma's delegation ranked very high. Sen. Jim Inhofe received a 94% (7th in the Senate), Sen. Tom Coburn got a 93% (8th in the Senate, and Rep. Jim Bridenstine received a 92% (8th in the House).

For the rest:

  • Rep. Markwayne Mullin: 75% (92nd in the House)
  • Rep. James Lankford: 70% (120th in the House)
  • Rep. Frank Lucas: 53% (189th in the House)
  • Rep. Tom Cole: 49% (208th in the House)
Only 25 Republicans ranked lower than Tom Cole in 2013, according to Club for Growth's scorecard.

CFG also tracks lifetime records for members of Congress. Here's how Oklahoma's members rate:
  • Rep. Jim Bridenstine: 97% (first year to be rated)
  • Sen. Tom Coburn: 96%
  • Sen. Jim Inhofe: 93%
  • Rep. James Lankford: 76%
  • Rep. Markwayne Mullin: 75% (first year to be rated)
  • Rep. Tom Cole: 70%
  • Rep. Frank Lucas: 66%

Saturday, February 08, 2014

County-by-County Majority/Plurality Party Map


This year, I decided to create a map showing the majority/plurality party in each county.

Majority Republican: 21 counties
Plurality Republican: 8 counties
Majority Democratic: 41 counties
Plurality Democratic: 7 counties

The counties closest to going from Democrat plurality to Republican plurality are Custer (Dem: 44.12%, GOP: 43.11%), Jackson (Dem: 47.41%, GOP: 41.72%), Pawnee (Dem: 47.74%, GOP: 41.97%), Pottawatomie (Dem: 47.33%, GOP: 40.67%), and Nowata (Dem: 48.57%, GOP: 40.37%).

Friday, February 07, 2014

Map: GOP Voter Registration Growth


Continuing the voter registration maps series, here's the updated GOP growth map (compare to 2012). Again, the GOP grew percentage-wise in 75 of 77 counties, but as slower rates than in 2013. Keep in mind that the state election board just went through an inactive voter purge, and that the 2012 election cycle drove up registration and re-registration rates.

Thursday, February 06, 2014

County-by-county voter registration swings, 1/2013 to 1/2014


Updating my voter registration maps series, we now look at the overall direction voter registration moved in each county from January 2013 to January 2014. Overall, 75 counties posted swings to the GOP, while the Democrats only had two counties where they outgrew the Republicans.

The growth for the GOP was slower than in 2012 (see here for last year's map), but still on track for the GOP to overtake the Democrats this year.

Wednesday, February 05, 2014

Oklahoma Voter Registration Map, January 2014


Continuing a series from last year, here is an update on voter registration in Oklahoma. Republicans continue to make gains, increasing by 0.76%, while the Democratic Party lost 0.71%. Independents decreased by 0.05%.

No county changed hands this year, in terms of plurality party. However, if you this to compare to last year, many counties posted noticeable changes.

Stay tuned for more posts on this series.

Tuesday, November 12, 2013

Bartlett defeats Taylor in Tulsa mayoral race

Mayor Dewey Bartlett, Jr.

As of 8:45pm CST, incumbent mayor Dewey Bartlett (R) appears to have solidly defeated his predecessor, Kathy Taylor (D), in Tulsa's mayoral election. KOTV reports Bartlett with 57% and Taylor with 43%, with 84% of precincts reporting.

Former Mayor Kathy Taylor

Although ostensibly non-partisan (Tulsa moved to non-partisan city elections following the 2012 election), this contest turned out to be extremely partisan. While non-partisan races may sound like a nice idea, in actuality, unless the city has a population under 50,000 or so, it doesn't matter -- municipal races will be partisan.


Tuesday, September 24, 2013

County Party Finances: Net Growth for 2013

In a (delayed) continuation of my County Party Finances series, let's take a look at the net growth through mid-year 2013.

REPUBLICANS

Republican county parties statewide netted a total of $24,336.22 through June 30th. 10 counties made financial gains (combining for +$34,447.30), and 7 counties posted net losses (combining for -$10,111.08), with Oklahoma County dropping over $7,500 after what appears to have been a rather expensive Lincoln-Reagan Dinner with guest speaker Kansas Governor Sam Brownback.


DEMOCRATS

Only three Democrat county parties showed positive gains in their financial reports. Osage County raised and spent nothing, leaving 13 counties that reported net losses. The combined total for the Democrats statewide is -$10,290.39. 11 counties dropped less than $700, but Payne County and Tulsa County showed net losses of -$5,167.69 and -$6,486.49, respectively. Tulsa County's activities correspond to the mayoral race underway in the city of Tulsa.

Monday, August 26, 2013

County Party Finances: Raised and Spent

Continuing my series on County Party Finances, let's examine receipts and expenditures a little more closely.

CASH RAISED

As we saw last time, both the Republicans and the Democrats have 17 county committees each that are "current" with the Oklahoma Ethics Commission. So far in 2013, Republican county parties have raised $80,585.70, while Democrat county parties have raised $68,732.01.


On the GOP side, Oklahoma and Stephens counties far and away led the pack, both with over $20,000 raised. Four other counties brought in between $5,000 and $9,000. Muskogee County comes in 5th, with $7,781 raised.


For the Democrats, an even greater disparity is shown. Tulsa County has raised over $30,000 through June 30th (remember, very competitive mayoral race), Cleveland County took in half that figure, and Oklahoma County came in at just over $9,000. Only two other counties raised more than $1,000.

MONEY SPENT

"It takes money to make money", the saying goes.


Republicans held true to their financial conservatism, and have spent significantly less than county Democrats so far in 2013. The biggest spenders for the GOP also posted the most money raised, although Oklahoma County alone ($30,163.81) accounts for over half of the money spent statewide among county GOP groups. The counties where higher amounts of cash were spent held major fundraising events (Lincoln-Reagan dinners, fish fries, barbecues, etc), hence the greater expenses. My county (Muskogee) was 3rd, at $3,801.05


Democrats spent over $22,000 more than Republicans. In fact, as another post will show, only three counties post net gains in their accounts through the mid-year report (on the other hand, ten GOP counties show positive balances). Tulsa, Cleveland and Payne counties spent $65,000 of the Democrats' statewide spending total of nearly $80,000.

Details by county after the fold.

Thursday, August 15, 2013

New Map Series: Finances of County Parties in Oklahoma

As my faithful readers know well, I have a certain fascination with maps and random data. I have previously created a map series on Voter Registration, and every election season post county-by-county Election Results maps. My newest series will be an examination of county political party finances.

For the purposes of this series, I only used party committees who have filed with the Oklahoma Ethics Commission in 2013. You may search the list of non-candidate committees for yourself at this link. Some county parties have filed in the past, but have not submitted their quarterly reports in 2013, or have not filed in many years. Still more counties have not properly filed with the Ethics Commission at all.

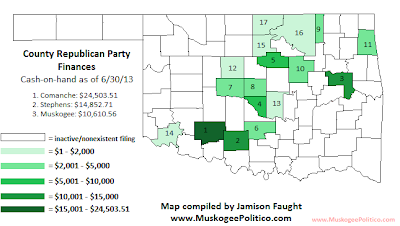
First up, current cash-on-hand for both Oklahoma Republican and Oklahoma Democratic county parties. Ironically enough, only 17 counties for both Republicans and Democrats have what I'm calling "current" filings with the Ethics Commission (meaning they have filed either their March 31st quarterly, or the June 30th quarterly report).

Ten of these counties have both Republican and Democrat parties that are "current" (Canadian, Cleveland, Creek, Garvin, Kingfisher, Oklahoma, Osage, Payne, Pottawatamie, and Washington counties).


All 17 county Republican parties post positive balances, with the top three slots belonging to Comanche County ($24,503.51), Stephens County ($14,852.71), and Muskogee County ($10,610.56). The total cash-on-hand among the 17 counties is $86,422.24, for an average of $5,084.

Conspicuously absent from the GOP list is Tulsa County, which has not filed a quarterly reports since 2007. I find this interesting, as the city of Tulsa is in the throes of a competitive mayoral race, and has had tough races within the county in the time since 2007.


As with many other things, Oklahoma's Democrats trail the Republicans. Their top three come in at lower amounts: Cleveland County ($12,505.27), Payne County ($10,093.48), and Tulsa County (9,903.84). Total cash-on-hand for their active 17 counties is $53,540.16, an average of $3,150. Kingfisher County posts a negative balance of -$337.32.

Next time, we will dig further into the receipts, expenditures, and 2013 net growth.

Saturday, January 19, 2013

Democrats lost voters in 49% of Oklahoma counties in 2012

As the previous maps have shown, 2012 was a banner year for Republicans, to the detriment of the Oklahoma Democratic Party. Today, we look at numerical growth figures per county.

For Republicans and Independents, every county showed a net increase of voters. Statewide, the GOP added 69,389 voters, and Independents grew by 27,381. Tulsa County had the highest raw growth for Republicans, at +11,636, while Oklahoma County was top for Independents at +5,789.


On the other hand, Democrats show a different story. While they did grow by 18,789 voters statewide, only 39 of 77 counties had net increases, while 38 had net losses. The top numerical increase for Democrats came in Oklahoma County (+7,738), and the greatest decrease was in Rogers County (-503).

As bad as that is, things look even worse when you compare Democrats' numerical growth to that of Independents and Republicans on a county-by-county basis.


In only 16 counties did Democrats add more voters than Independents.


Republicans added more voters than Democrats in 74 of 77 counties.

It's a great time to be a Republican in Oklahoma. Not so much if you're a Democrat.

Friday, January 18, 2013

Voter Registration Growth by Party

This addition to the MuskogeePolitico.com's voter registration map series shows growth as a percentage in each county per political party.


Percentages for Republicans grew in 75 of 77 counties, coming short of positive growth only in Adair (-0.09%) and Oklahoma (-0.21%) counties. Marshall County Republicans grew by 3.77%, the largest percentage in the state.


Democrats had a terrible year, growing in percentage only in Adair County (+0.12%). Marshall County was the worst, coming in at a loss of 4.45%. Far western and southern Oklahoma is where the brunt of loss came for the Democratic Party.


Independents grew at a slow rate, dropping in percentage in Adair County (-0.03%), but gaining in the rest of the state. Ottawa County had the greatest percentage jump, at 1.39%.

Thursday, January 17, 2013

County-by-county voter registration swings, 1/2012 to 1/2013


Continuing my map series on voter registration, this shows the county-by-county trend from last January. Democrats had a positive trend in only one county (Adair), and that was only +0.29%. Republicans netted positive percentages in the other 76 counties, capped with +8.22% in Marshall County.

With the rate at which the GOP is catching up to the Democrats, the Republican Party will likely take the lead in voter registration sometime in 2014.

Wednesday, January 16, 2013

Oklahoma Voter Registration Map, January 2013


In a follow-up to yesterday's post, I've compiled a map visualizing voter registration in Oklahoma. As you can see, Democrats still dominate registration rates in most of southern and eastern Oklahoma counties, but struggle in the higher population metropolitan areas.

Contrast this with my Election Results Maps series, and compare the registration rates to the actual voting data.